

Combining multiple datasets into a single interactive tool is critical in an era when data drives decision-making. I'm excited to share a comprehensive web map I created that incorporates administrative boundaries, student locations, environmental data, and school distribution analysis. This map is more than just a visualization tool; it represents a step toward making data actionable and accessible to communities, students, researchers, and policymakers.
A Glimpse into the Web Map
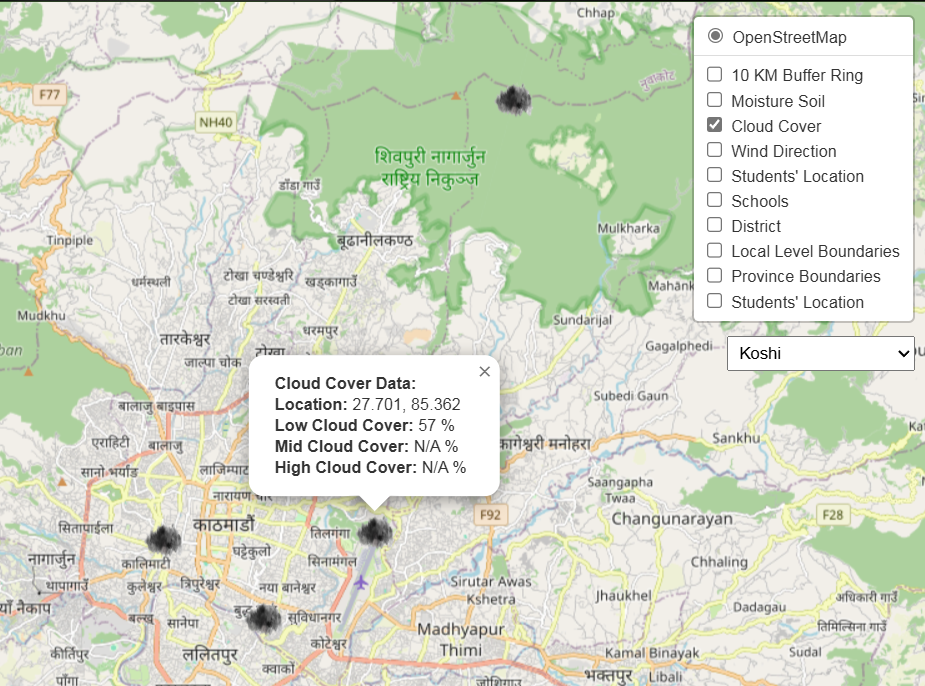
This web map was created with the goal of bridging disparities in information and providing an easy-to-use platform for exploring multiple datasets. The features are described in detail below, along with their significance and potential applications.
Administrative Boundaries
The map prominently displays the administrative boundaries of Nepal's provinces, districts, and municipalities. To distinguish between administrative levels, each boundary is clearly marked and colored.
Interactive Exploration: Clicking on any administrative region yields detailed information, such as its name and hierarchical level.

Map Showing the Province Information
 |
| Map Showing Information of Local Level |
Mapping and Filtering Student Locations:
Geo-located data: The map pinpoints each student's residence, providing precise distribution insights. This allows for a clear understanding of where students are located, making it an effective tool for outreach and planning.


Cluster Identification: Universities can identify concentrated groups of students and plan targeted outreach programs or networking events.
Enrollment Trend Analysis: Visualizing this data over time can aid in identifying enrollment trends and their correlation with geographical factors.
Environmental Data from API:


Nearby Schools: Data from OpenStreetMap
The nearby schools displayed on the map are obtained using OpenStreetMap (OSM) data, downloaded through the powerful Overpass Turbo query tool.
10 km Buffer Analysis:
The schools shown are within a 10 km buffer radius of home location (Damak Jhapa), providing a focused view of educational institutions nearby. This radius ensures that the map highlights schools that are realistically accessible from the central reference point.


Enhanced Explanation:
Using OpenStreetMap ensures up-to-date and community-curated data, while Overpass Turbo enables precise filtering of schools within the selected area. The 10 km buffer acts as a boundary for relevant data, making the map both comprehensive and relevant for practical applications.


0 Comments